Building Supportable Systems (Performance & Diagnostics)
Isolating performance issues or tracing web traffic problems can be a challenge. Modern browsers have excellent developer tools and 3rd party tools like Fiddler are also great for this job, but they only give you so much information. Sometimes you want to get more in-depth information around the request processing times, or the configuration variables on the server.
Whilst the browser developer tools ("F12 tools") are getting better and better with each release of browsers now, there is still a class of problem which can't be solved by these client-side tools. In the case where a change to a web page might increase the page load performance by a few hundred milliseconds, but under heavy load has the potential to totally incapacitate your entire website, a tool like Glimpse is an excellent way to identify the performance information of the specific page or area where you are currently working.
Glimpse (http://getglimpse.com/) is an indispensable tool and it fits right into the problem space explained above. It (optionally) displays itself as a browser popup area at the base of every page and shows various statistics about page load times, database accesses, queries and other useful web request pipeline information. There are a number of additional plugins to enhance the detail in specific areas such as specialised databases, content management systems and routing libraries.
As with all the other tools I've been describing Glimpse is installed by way of a NuGet package (the other four are optional extensions).
Install-Package Glimpse
Install-Package Glimpse.AspNet
Install-Package Glimpse.Mvc5
Install-Package Glimpse.EF6
Install-Package Glimpse-Knockout
To enable Glimpse either follow the instructions on the web page that was displayed when you installed the packages, or go to ~/Glimpse.axd and follow the presented directions.
Glimpse-ing into the mind of the machine...
The initial view of Glimpse in action will be a toolbar-style information block something similar to the following one displayed at the base of your page. As you navigate around your ASP.NET website this info-bar will automatically update to display information about the HTTP request, Server activities, MVC controller load times and any AJAX calls and timings.
Once you've found the page you're interested in, or are working on, you can get more detailed information on the three main areas (HTTP,HOST,AJAX) by hovering your mouse over them. When you do this a more detailed information pane will pop up and display a breakdown of the page load timings.
Detailed View
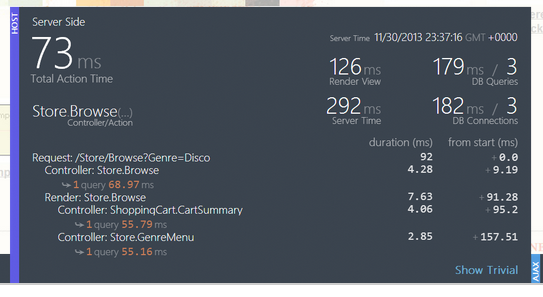
Glimpse will break this down into quite detailed sections of information, and if your MVC Controller makes database calls you'll even get a breakdown of how many calls and how long they took.
In the example above you can see that there were 3 database queries which each took around 50-60ms and that the view took 126ms to render. This isn't a particularly good example as there isn't a glaring problem to look at. Often you'll see situations where there's a huge time spent in one area (Render, or Query) and you can start digging into that area to try and optimise the page.
Super Detailed View
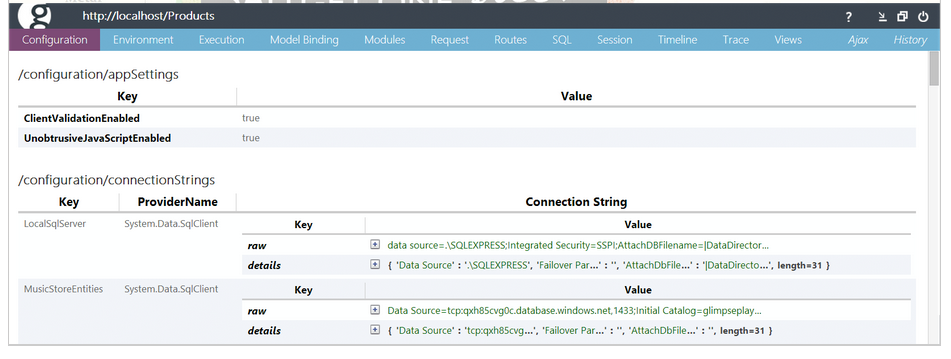
The final area of Glimpse is the detailed view. This is accessed by clicking on the "g" at the right of the original Glimpse info-bar. As you can see from the example below there is a huge amount of information available at your fingertips ranging from the web.config configuration settings, through to server-side model binding information, loaded modules, MVC routes and even client-side SPA binding information.
In Summary
Glimpse is a very easy tool to get started with, and it offers a valuable insight into the inner workings of your ASP.NET website. It's one of those tools that way more people should know about and be using to help diagnose those tricky performance-related issues when developing MVC websites. I'd strongly urge anyone who's working on .NET websites to check it out.


