Building Supportable Systems (Instrumentation & Metrics)
Gathering useful instrumentation about running applications such as throughput and performance can be tricky, but invaluable for understanding bottlenecks or latency problems. There are a number of commercial products that cover this area such as AppDynamics, AppInsights, New Relic, Stackify etc... I've had some experience with these tools (especially AppDynamics) and I would say if you're going to be supporting an application in production where there would be financial impacts if your application is performing badly or fails in production, then spend the money on one of these tools.
Having said that, I don't think the use of an off-the-shelf product is an excuse to skip adding your own metrics to an application, especially when there are a variety of open-source options. One of the greatest benefits to implementing your own metrics within your application is that you can instrument only the areas you care about. Another benefit is that you don't need to depend on 3rd party infrastructure (such as data collection agents, or cloud services) which might be difficult to configure or maintain depending on your deployment environment.
Metrics.Net
The Metrics.Net project https://github.com/etishor/Metrics.NET makes it pretty simple to gather these metrics and is based on a Java port of Metrics. Metrics.Net also provides an easy interface for create health monitoring endpoints and I'll cover that in a future post.
To get started, just install the Metrics.Net NuGet package in the usual way. There is a base install which provides the core functionality, and there are additional extensions to this which provide tight integration with OWIN and NancyFx.
Install-Package Metrics.Net
Once you've installed the base packages you can configure it in your app startup. I'll demonstrate the functionality through a console app (it works in pretty much any .net project type). In my main method I will add the following block of code. This will configure Metrics.Net and also expose an HTTP endpoint at "/metrics" where the metrics can be viewed through a web browser. The "WithAllCounters" call will also enable the capture of metrics around .NET resource usage.
Metric.Config
  .WithHttpEndpoint("http://localhost:1234/metrics/")
  .WithAllCounters();
The next thing to do is to add some readonly properties to any classes you wish to instrument. For example if you have a transaction processing class, or an MVC Controller you can add metrics to count the number of calls being made, or the number of active connections to a SignalR Hub.
private readonly Timer timer = Metric.Timer("Requests", Unit.Requests); private readonly Counter counter = Metric.Counter("ConcurrentRequests", Unit.Requests);
Now that everything's set up, it's just a matter of calling the appropriate method on the fields. In this case I'm incrementing and decrementing a counter so I can get a count of "in progress" calls, as well as using the timer field to gather metrics on how long a particular task is taking to call. Metrics.Net will then aggregate, slice and dice the data into useful statistics.
public void Process(string inputString)
{
  counter.Increment();

  using (timer.NewContext())
  {
    // do something to time
    System.Threading.Thread.Sleep(1230);
  }

  counter.Decrement();
}
Visualisation
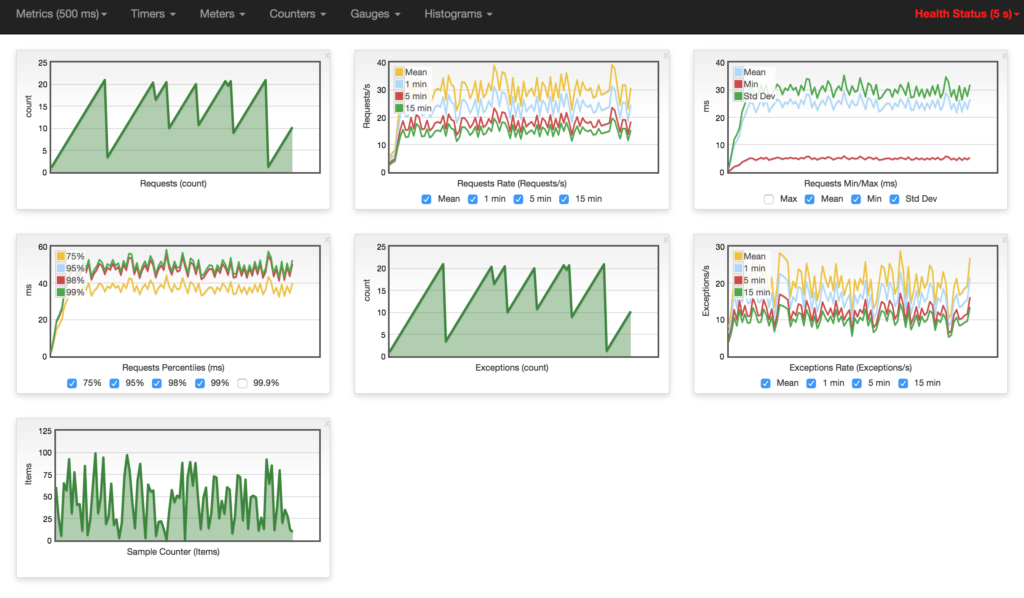
Metrics.Net makes it relatively simple to visualise the data you're capturing by providing an HTML5 dashboard. Though I wouldn't suggest using this as your only means of gathering metrics (as it's stored in volatile memory) it's a great way to get started. For more permanent storage of metrics data I would suggest looking into the (currently alpha) support for pushing metrics data into another persistent storage system such as InfluxDb, Graphite or ElasticSearch.
The composition of the dashboard can be configured to some extent through the use of the menus across the top of the dashboard. It's possible to turn various metrics on and off easily, and to modify the polling interval. From what I can tell it's just polling the internal state of the gathered metrics, so while it's not ideal to pull every 200ms, it's not re-calculating everything - just grabbing the stats.
Metrics.Net also includes the ability to tag and categorise them for reporting purposes. At the time of writing, the dashboard doesn't support extensive filtering or grouping based on these tags but I suspect this will change in the not-to-distant future.
Integration
While it's very useful to gather metrics for a single instance of an application, the power of Metrics.Net is probably only really apparent once you start to aggregate the data collected. There a few options here and as mentioned above there's experimental support for live exporting of the instrumented data into a number of databases specifically designed for this type of thing (InfluxDb, Graphite, ElasticSearch).
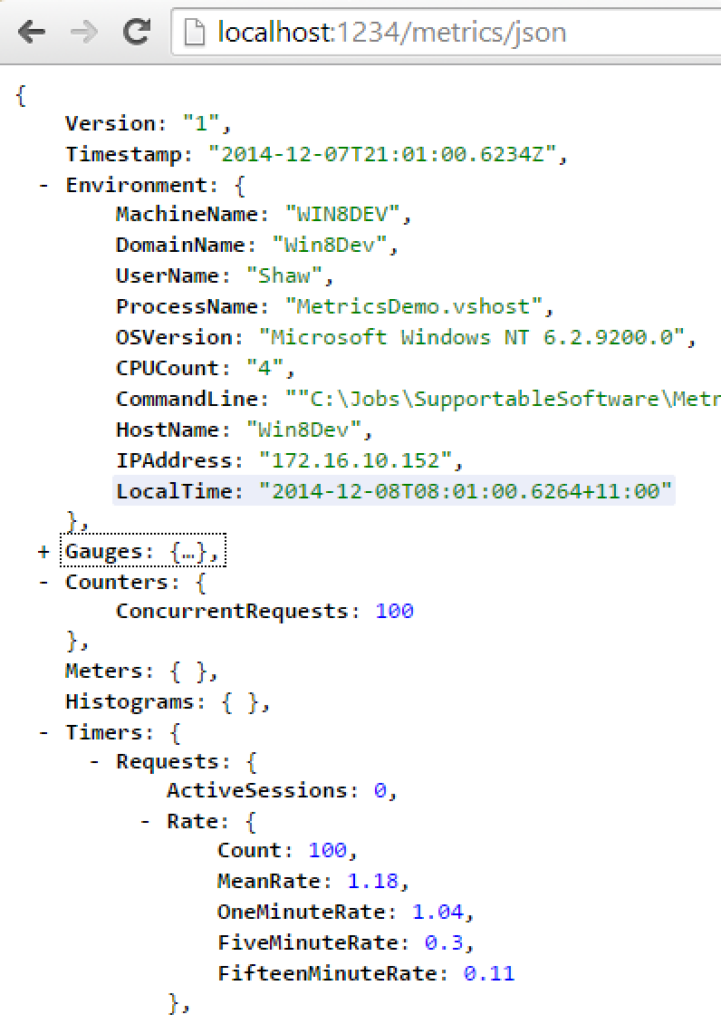
However there is another feature of Metrics.Net which is extremely useful for either aggregating the data, or for integration into your own custom web dashboards. By appending "/json" to the end of your metrics dashboard URL you can receive a json feed of the raw and aggregated data as can be seen below.
Summary
The use of Metrics.Net (or other similar projects) is a great way to quickly increase the supportability of any application (whether cloud-based or not) and the Metrics.Net project in particular is undergoing constant development and improvement with the addition of integration features which will bring it into a more "enterprise" class of library.

