Server-Side Geospatial Clustering
I was recently asked by a colleague to help brainstorm a solution to displaying a large number of data points onto a leafletjs map on a client project. The problem was that although client-side clustering was working in most instances, it was suffering from performance problems due to having to send the entire dataset to the client before performing the clustering.
One proposed solution which we implemented was to round the latitude and longitude of the resulting data with lower precision which would effectively group nearby points onto a single location which could be grouped. While this worked, it didn't seem clean to me so I decided to do some further research into established solutions for this.
TL;DR - I've created a working sample project for this here
Constraints
In this particular scenario I wanted to limit options to things that would meet the following criteria:
- .NET Core
- Entity Framework Core
- MSSQL Spatial Extensions (though in the POC below I used PostGIS)
- Server-side clustering
Possible Solutions
Conceptually I think the solution was to work out a deterministic way to group spatial points into buckets of some sort. After a bit of googling I found the following possible solutions:
Lower-precision Latitude & Longitude coordinates
This has the issue of Latitude vs Longitude being +/- 90 vs +/- 180 deg so it's non-even distribution, maybe all of options have this flaw.
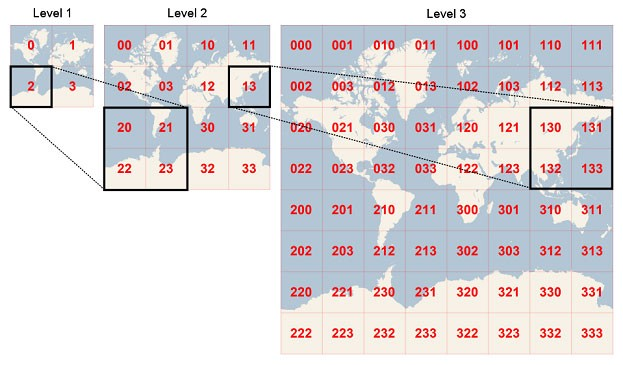
GeoHash & QuadKey
These algorithms use a hierarchical square grid of varying precision and are able to provide a deterministic hash which represents the given location. By passing a latitude, longitude and the desired precision to the algorithm it's possible to generate hashes of different zoom levels.
For a full explanation check out Geohash on Wikipedia
This is a visual representation of QuadKey
Uber H3 spatial indexes
The Uber H3 algorithm is also a hierarchical grid, however it uses hexagonal grids rather than square ones.
The H3 Website explains how the algorithm works, as well as providing a number of comparisons to alternatives.
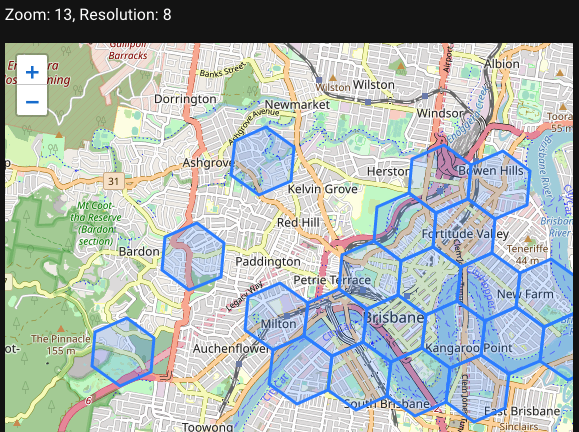
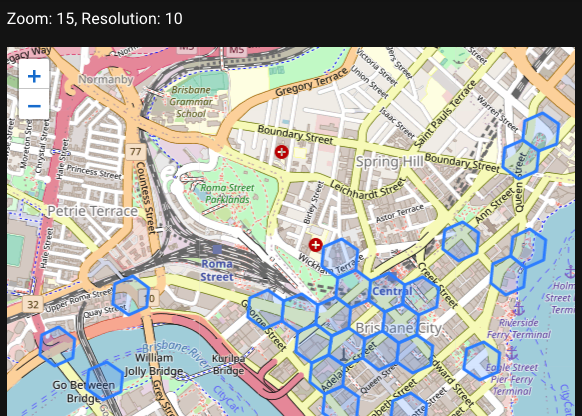
H3 has a concept of resolutions which are like zoom levels. The higher the resolution, the greater number of hexagonal cells are required to cover the mapped area.
At the following resolutions, these are the approximate edge lengths for the hexagonal cells.
 5 = 8km edge
 6 = 3km edge
 7 = 1.2km edge
 8 = 0.46km edge
 9 = 0.17km edge
So, given the following three locations in Brisbane which are relatively close to each other we should be able to demonstrate how the H3 index works at different levels. I'll be using PostGIS queries to demonstrate this.
[153.0318,-27.461301] & [153.023846,-27.468692] are around 1.2km apart
[153.026583,-27.466333] & [153.023846,-27.468692] are around 400m apart
SELECT
  5 AS R,
	h3_geo_to_h3(POINT('153.0318,-27.461301'), 5) AS P1,
	h3_geo_to_h3(POINT('153.023846,-27.468692'), 5) AS P2,
	h3_geo_to_h3(POINT('153.026583,-27.466333'), 5) AS P3
UNION
SELECT
	6 AS R,
	h3_geo_to_h3(POINT('153.0318,-27.461301'), 6) AS P1,
	h3_geo_to_h3(POINT('153.023846,-27.468692'), 6) AS P2,
	h3_geo_to_h3(POINT('153.026583,-27.466333'), 6) AS P3
UNION
SELECT
	8 AS R,
	h3_geo_to_h3(POINT('153.0318,-27.461301'), 8) AS P1,
	h3_geo_to_h3(POINT('153.023846,-27.468692'), 8) AS P2,
	h3_geo_to_h3(POINT('153.026583,-27.466333'), 8) AS P3;
In the following table, you can see that at resolution 5, all three points fall within the same H3 index cell which results in the same hash value.
As the resolution is increased to 6, two of the points are still within the same cell, however P2 is now outside the cell boundary.
When the resolution is further increased to 10, all three points are in different cells.
| Resolution | P1 | P2 | P3 |
|---|---|---|---|
| 5 | 85be8d13fffffff | 85be8d13fffffff | 85be8d13fffffff |
| 6 | 86be8d107ffffff | 86be8d12fffffff | 86be8d107ffffff |
| 10 | 8abe8d1052a7fff | 8abe8d12acaffff | 8abe8d10534ffff |
H3 Spatial Indexes in .NET Core & LeafletJS
The following code snippets show the key implementations to provide a clustering endpoint using ASP.NET Core, PostGIS, Npgsql, and pocketken.H3.
Server-side Clustering Implementation
Required Libraries
| Library | Purpose |
|---|---|
| Npgsql.EntityFrameworkCore.PostgreSQL | Postgres EF Driver |
| Npgsql.EntityFrameworkCore.PostgreSQL.NetTopologySuite | Spatial Extensions for Postgres |
| NetTopologySuite.IO.GeoJSON4STJ | GeoJSON serialisation for spatial data types |
| pocketken.H3 | Native .NET Core implementation of the Uber H3 toolset |
Startup.cs
public void ConfigureServices(IServiceCollection services)
{
	// Register the NetTopologySuite GeoJSON Serialisation methods
	services.AddControllers()
		.AddJsonOptions(o =>
			o.JsonSerializerOptions.Converters.Add(new NetTopologySuite.IO.Converters.GeoJsonConverterFactory())
		);

	// Register a DBContext, Use Postgres, Use NetTopologySuite Spatial Types
	services.AddDbContext<PostGisDbContext>(o =>
	    o.UseNpgsql(Configuration.GetConnectionString("PostGisContext"),
			n => n.UseNetTopologySuite()));
		}
}
The following code is deliberately non-optimised to ease readability
DataController.cs
// Natively query the database.  In this case, filtering by a bounding box being passed into my API endpoint.
var itemQuery = _dbContext.PublicArts
	.Where(p => p.TheGeom.Within(boundingPoly))
	.AsEnumerable();

// Cluster the raw data by using the H3Index library
var cluster = itemQuery
	.GroupBy(p => H3Index.FromPoint((Point)p.TheGeom, resolution))
	.Select(p => new ClusterItem
	{
		Index = p.Key.ToString(),
		Boundary = p.Key.GetCellBoundary(),
		Count = p.Count(),
	}).ToList();

// Map the clustered into a spatial FeatureCollection which can be serialised into GeoJSON
var featureCollection = new FeatureCollection();
foreach (var item in cluster)
{
	featureCollection.Add(new Feature(item.Boundary, new AttributesTable(new Dictionary<string, object>()
	{
		{ "Index", item.Index },
		{ "Count", item.Count },
	})));
}
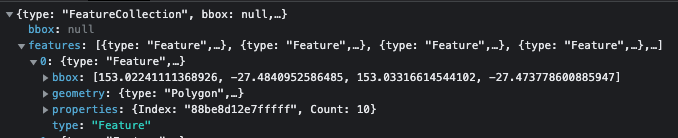
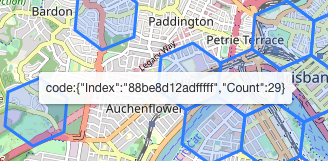
Calling the above endpoint returns a GeoJSON payload similar to the following, more properties can easily be added to display other metadata on the clusters. In this POC I am just displaying the number of clustered objects.
Vue + LeafletJs Front End Implementation
This post won't focus heavily on the client-side implementation as the point was to provide a server-side clustering capability.
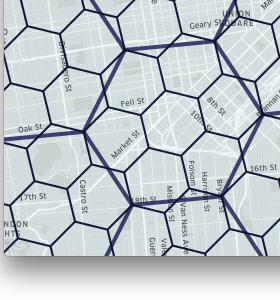
By providing the clustered response from the API as GeoJSON it can be easily mapped using any of the popular web mapping libraries.
I built a small Vue/Nuxt application using LeaftletJs to query the API and use a GeoJSON layer to display the clustering in an interactive way.
Vue Component Snippet
<div id="map-wrap" style="height: 100vh">
	<client-only>
	  <l-map
		:zoom="zoom"
		:center="center"
		@ready="mapReady"
		@update:zoom="zoomUpdated"
		@update:center="centerUpdated"
		@update:bounds="boundsUpdated">
		<l-tile-layer :url="url"/>
		<l-layer-group>
		  <l-geo-json
			:options="options"
			:geojson="geoJson"/>
		</l-layer-group>
	  </l-map>
	</client-only>
</div>
Vue Component Data Retrieval Function
async getGeoJson() {
	const bbox = [this.bounds.getEast(), this.bounds.getNorth(), this.bounds.getWest(), this.bounds.getSouth()];
	const geojson = await this.$axios.$get(`http://localhost:5000/data/cluster?zoom=${this.zoom}&resolution=${this.resolution}&bbox=${bbox}`);
	this.geoJson = geojson;
}
As you can see here, it's easily possible to use the properties included in the GeoJSON data.
Next Steps
Because the H3 Indexes produce a deterministic hash for any given Lat/Lon/Resolution it would be relatively simple to build a server-side caching layer for regularly accessed queries.
Other Resources
PostGIS
There is also a PostGIS implementation of H3 which is available here: https://github.com/bytesandbrains/h3-pg
SELECT h3_geo_to_h3(POINT('37.3615593,-122.0553238'), 5);

  h3_geo_to_h3
-----------------
 85e35e73fffffff
Python
from h3 import h3
import folium
def visualize_hexagons(hexagons, color="red", folium_map=None):
"""
hexagons is a list of hexcluster. Each hexcluster is a list of hexagons.
eg. [[hex1, hex2], [hex3, hex4]]
"""
polylines = []
lat = []
lng = []
for hex in hexagons:
polygons = h3.h3_set_to_multi_polygon([hex], geo_json=False)
# flatten polygons into loops.
outlines = [loop for polygon in polygons for loop in polygon]
polyline = [outline + [outline[0]] for outline in outlines][0]
lat.extend(map(lambda v:v[0],polyline))
lng.extend(map(lambda v:v[1],polyline))
polylines.append(polyline)
if folium_map is None:
m = folium.Map(location=[sum(lat)/len(lat), sum(lng)/len(lng)], zoom_start=13, tiles='cartodbpositron')
else:
m = folium_map
for polyline in polylines:
my_PolyLine=folium.PolyLine(locations=polyline,weight=2,color=color)
m.add_child(my_PolyLine)
return m
def visualize_polygon(polyline, color):
polyline.append(polyline[0])
lat = [p[0] for p in polyline]
lng = [p[1] for p in polyline]
m = folium.Map(location=[sum(lat)/len(lat), sum(lng)/len(lng)], zoom_start=13, tiles='cartodbpositron')
my_PolyLine=folium.PolyLine(locations=polyline,weight=2,color=color)
m.add_child(my_PolyLine)
return m
# define a bounding box
geoJson = {'type': 'Polygon',
'coordinates': [[
[-27.427242460262416,153.05448532104492],
[-27.427242460262416,152.95680999755862],
[-27.557895036114385,152.95680999755862],
[-27.557895036114385,153.05448532104492],
[-27.427242460262416,153.05448532104492]
]]}
polyline = geoJson['coordinates'][0]
polyline.append(polyline[0])
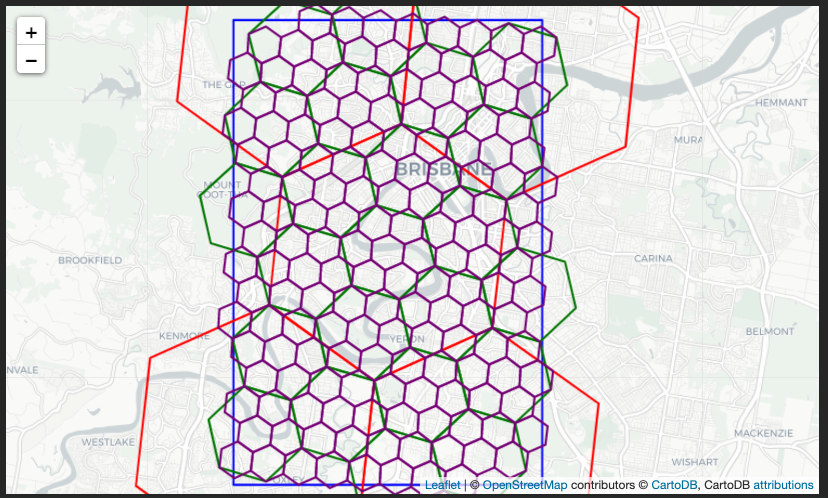
m = visualize_polygon(polyline, color="blue")
m = visualize_hexagons(list(h3.polyfill(geoJson, 6)), color="red", folium_map=m)
m = visualize_hexagons(list(h3.polyfill(geoJson, 7)), color="green", folium_map=m)
m = visualize_hexagons(list(h3.polyfill(geoJson, 8)), color="purple", folium_map=m)
display(m)