Building Supportable Systems (Monitoring)
Once an application is running in a production environment it can become more complicated to access the systems the application is running on. For example that the web servers might be running in a DMZ where the developers don't have access to easily view logs (though this shouldn't be the case if you read the previous article about log management). Another example is when you have a website or application which has down-stream system dependencies such as APIs or back-end database systems, and you want to know if these systems are healthy to determine the health of your own application.
Without the ability to quickly gauge the health of your application and its dependencies, you can waste a lot of time fault finding outages in your application which might not actually be a result of your code.
More Metrics.Net
Once again, the Metrics.Net NuGet package comes to the rescue here. One of the features it offers is a "health check" implementation which can be monitored and the results aggregated. If you don't already have Metrics.Net in your project, you can add it in the usual way:
Install-Package Metrics.Net
Once installed it's simply a matter of using the fluent configuration API to specify an endpoint and counters configuration. In the following example I'm registering two HealthCheck classes, one to check the availability of a database (for example by creating and checking a persistent connection) and the other to ensure there is sufficient disk space on the server. These are pretty basic examples, perhaps your application or website depends on a back-end API or SOAP service, so in these cases you could perform a regular a status check on those.
Metric.Config
  .WithHttpEndpoint("http://localhost:1234/metrics/")
  .WithAllCounters();
HealthChecks.RegisterHealthCheck(new DatabaseHealthCheck());
HealthChecks.RegisterHealthCheck(new DiskHealthCheck());
Implementing HealthChecks
Implementation of the actual HealthChecks is very straight-forward and nicely encapsulated by deriving from a HealthCheck base class. For example:
public class DatabaseHealthCheck : HealthCheck
{
  private readonly IDatabase database;

  public DatabaseHealthCheck(IDatabase database) : base("DatabaseCheck")
  {
    this.database = database;
    HealthChecks.RegisterHealthCheck(this);
  }

  protected override HealthCheckResult Check()
  {
    // exceptions will be caught and
    // the result will be unhealthy
    this.database.Ping();

    return HealthCheckResult.Healthy();
  }
}
Monitoring HealthChecks
Viewing the state of your application health checks is very simple as well. You can either access them through the Metrics.Net web dashboard by going to ~/metrics (default) in your browser or you can call another endpoint to receive an HTML or JSON encoded version of the health check data.
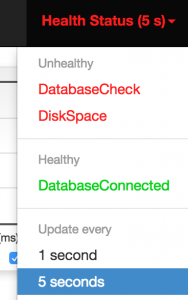
This image shows an example of what the web console displays for unhealthy (red, at the top) and healthy (green, below) health checks. As you can see it's really obvious which ones are failing at the time and you can quickly take action to rectify the problem(s).
Applied Health Checks
Another use for health checks is for application monitoring by network infrastructure such as load balancers. Most load balancers will periodically monitor an end-point on your website or application to determine whether the application is in a state capable of accepting traffic. If not, the load balancer will remove that instance of the application from its pool of available servers. This can be particularly useful if you have a farm of web servers and you want to distribute the load evenly across them or provide fault-tolerance.
Using the above health check process you can either create a specific implementation to respond to your load balancer query, or you can simply configure your load balancer to call the standard end-point and react based on the aggregate result of your health checks.
